Budget and Property Tax Statistics
The following is information and historical statistics related to Budgets and Property Taxes
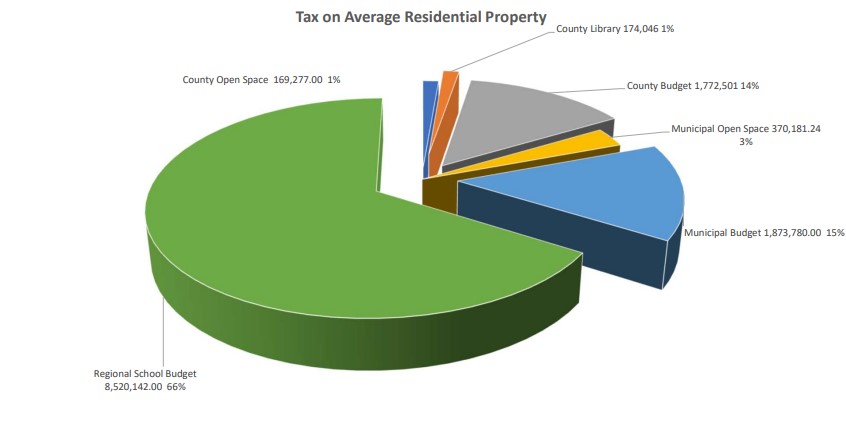
How Our Tax Dollars are Spent
The municipality collects taxes to support its own budget, as well as taxes on behalf of and to support County and School District budgets. The following chart shows a breakout of the tax obligation, in dollars and percentage, for an average assessed residential property in 2022.
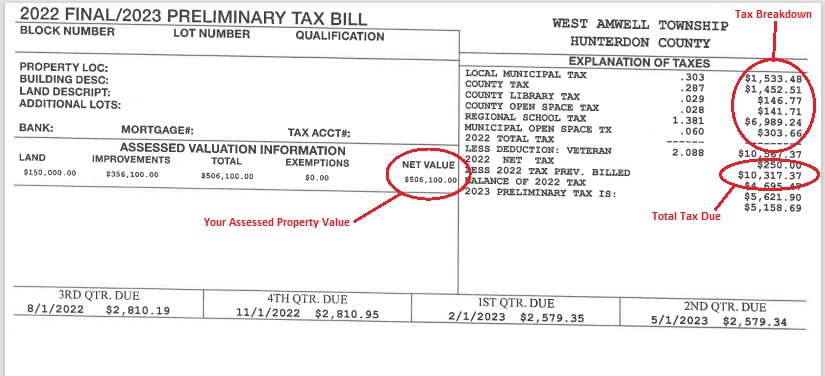
How to Read Your Tax Bill
You can find out how much you are paying in county, local government, and school district taxes from your annual tax bill. Below is a tax bill example.
Municipal Budget Expense Breakout
The municipal budget is used to fund municipal operations and services provided to residents. Below is a typical breakout of all municipal expenses covered by a budget and includes funds that go towards paying off debt and to support the open space program. Editor's note: stay tuned for an update to this chart.
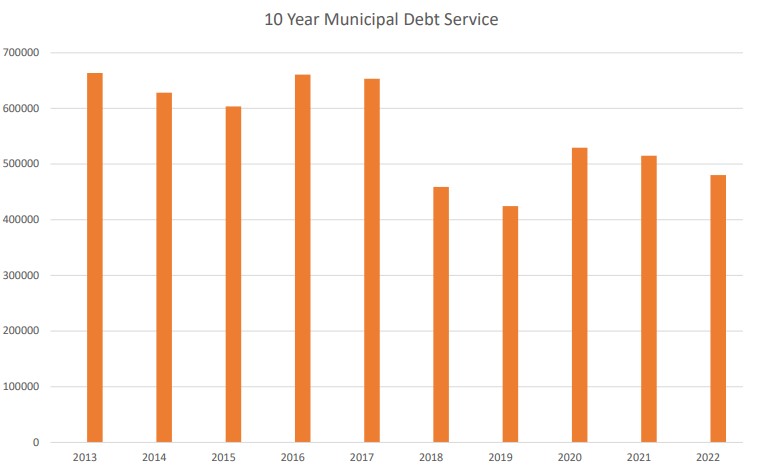
Historical Municipal Debt
Certain projects or purchases of high cost equipment cannot be funded via an annual municipal budget due to budget and/or revenue restraints (known as "caps"). Instead, a municipality will borrow money through long term bond debt. Below is an historical chart of the annual obligations to pay off municipal debt. Fluctuations typically reflect the maturing of bonds or refinancing to take advantage of lower prevailing rates.
Please note that the chart reflects the annual amounts to pay off the total municipality.long term debt.
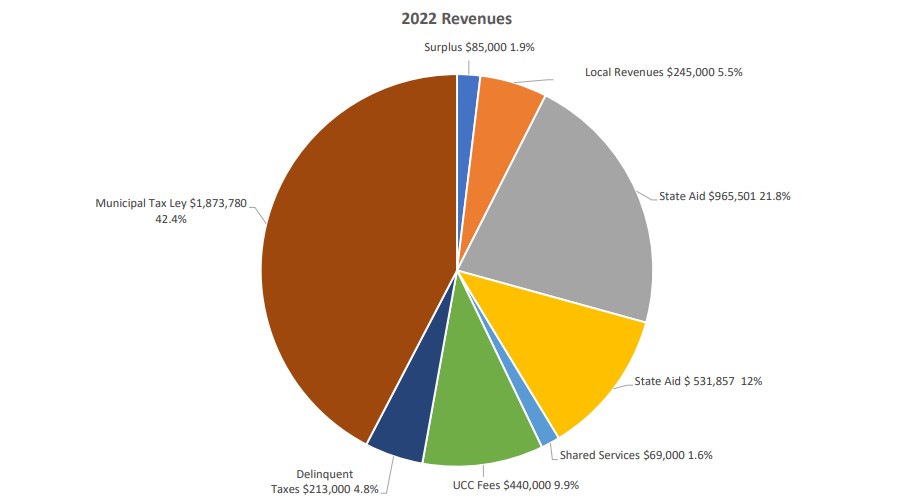
Municipal Budget Revenue Breakout
The municipal budget is funded through several revenue sources, including from state and local resources. Below is a typical breakout of municipal revenues and includes revenue to pay off debt and support the open space program.
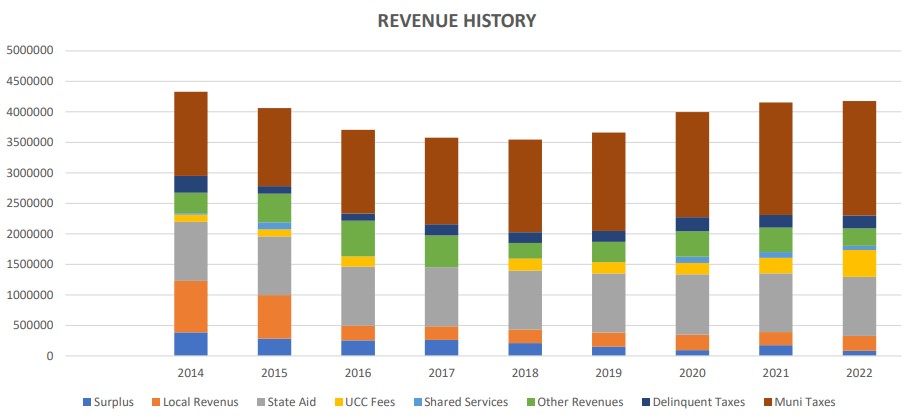
Historical Municipal Budget Revenue
Below is an historical chart showing the revenue resources received by the township to support its operating budget and open space fund, as well as pay off municipal debt.
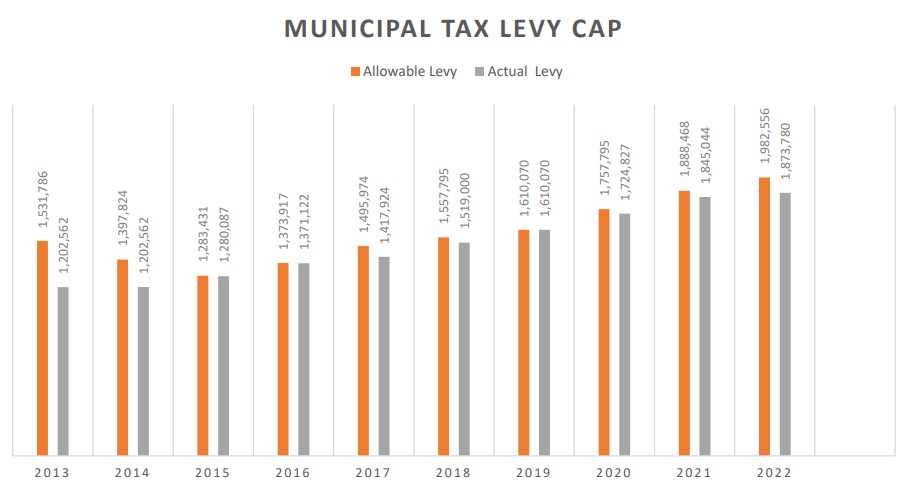
Actual Municipal Tax Levy vs Maximum Allowed Tax Levy
By state law, municipalities are allowed to increase tax levies for municipal purposes by 2% from year to year. This is known as a "Cap". The Cap only applies to levies that are used to fund the municipal operating budget. Any under utilized cap levies can be carried over and used in the following year if needed, thus allowing for a higher than 2% tax increase the following year. Typically however, as can be seen from the chart below, West Amwell tax levies have historically been below the maximum allowable levy.